
China’s freshly released economic data has shown resilient growth in the country compared to the previous quarter. China’s GDP in the first quarter surged to 2.2% from the previous quarter’s 0%, a favourable sign that could potentially stimulate higher oil prices. Moreover, the unemployment rate in China also dropped, further supporting the positive trend. Meanwhile, the dollar has maintained its bullish momentum this week, trading above $102, supported by hawkish statements from Federal Reserve officials. Market analysts are widely expecting another quarter-point rate hike from the Fed in May. In the equity markets, investors continue to trade cautiously as major indices in the U.S. showed marginal gains, with attention now focused on earning reports from prominent companies. Elsewhere, oil prices have remained steady above $82, while gold prices have experienced a significant decline, dropping below $2,000 from last week’s $2,048.
Current rate hike bets on 3rd May Fed interest rate decision:
Source: CME Fedwatch Tool
0 bps (12.9%) VS 25 bps (87.1%)
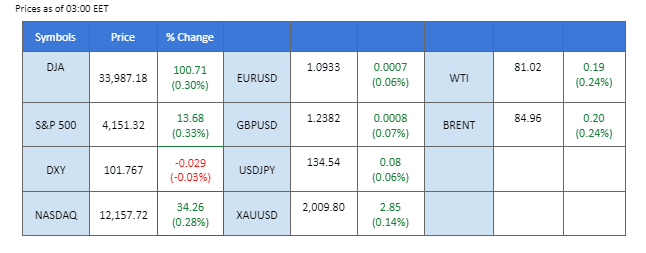
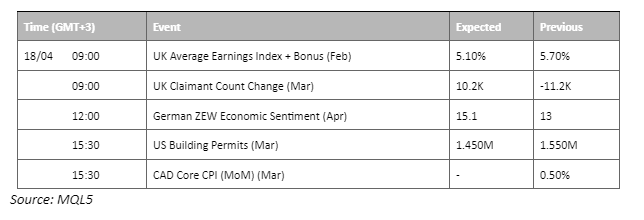
The greenback continued its upward trajectory on Monday, bolstered by renewed optimism surrounding the possibility of further policy tightening by the Federal Reserve. Treasury yields surged in response to hawkish statements made by several Fed members, including Richmond Fed President Thomas Barkin, who emphasised the need for concrete evidence that US inflation is easing back to the central bank’s target of 2% before considering any slowdown in the tightening process. Barkin’s comments echoed the previous hawkish sentiment expressed by Christopher Waller.
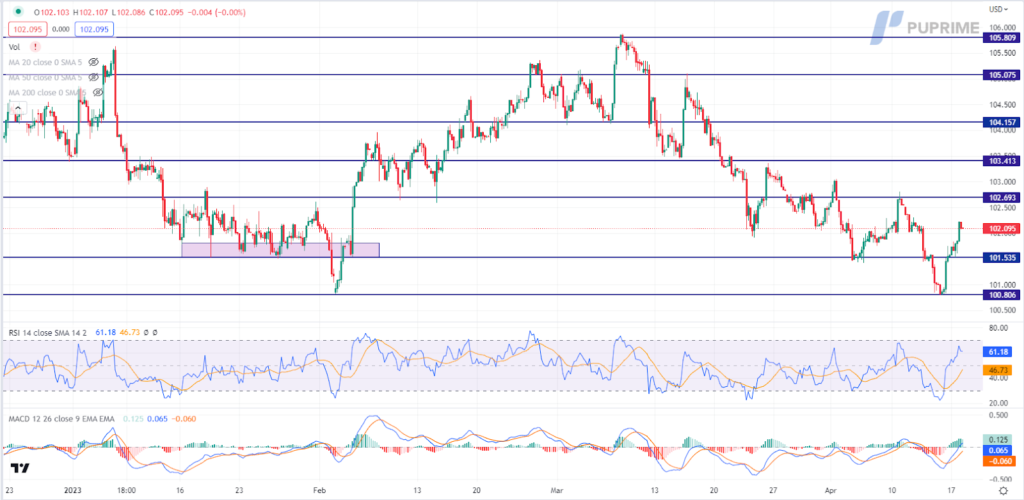
The Dollar Index is trading higher following the prior breakout above the previous resistance level. MACD has illustrated increasing bullish momentum, while RSI is at 61, suggesting the index might extend its gains since the RSI stays above the midline.
Resistance level: 102.70, 103.40
Support level: 101.55, 100.80
Gold prices took a significant hit on Monday, as the US Dollar strengthened, and investors anticipated an upcoming rate hike by the Federal Reserve. The surge in Treasury yields was a direct result of hawkish statements from several Fed members, including Richmond Fed President Thomas Barkin, who echoed previous hawkish sentiment expressed by Christopher Waller. Barkin emphasised the need for concrete evidence that US inflation is easing back to the central bank’s target of 2% before considering any slowdown in the tightening process.
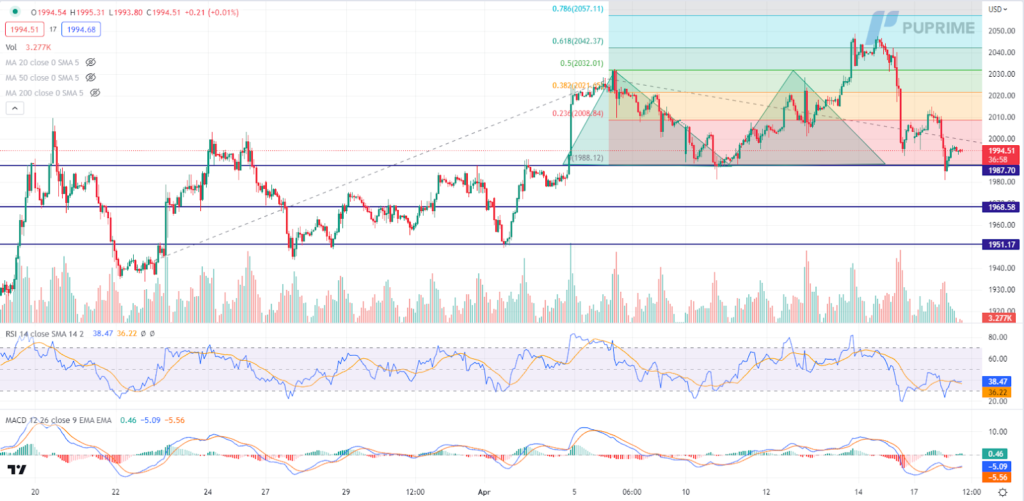
Gold prices are trading lower while currently near the support level. However, MACD has illustrated increasing bullish momentum, while RSI is at 38, suggesting the commodity might be traded higher as technical correction since the RSI rebounded sharply from oversold territory.
Resistance level: 2010.00, 2020.00
Support level: 1990.00, 1970.00
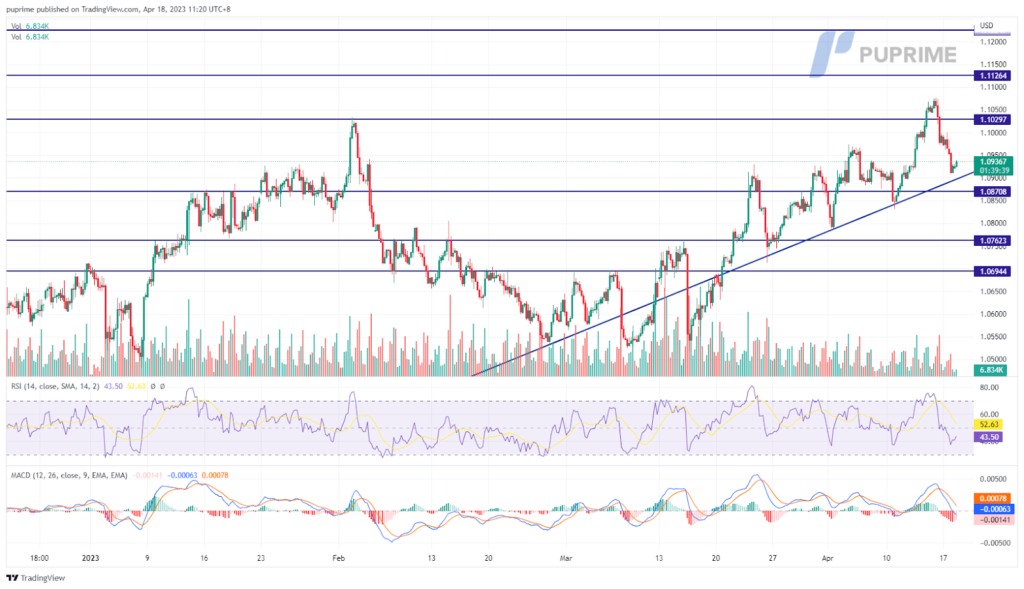
The euro has been hammered down by more than 1% since last Friday’s peak at 1.1076 as the dollar has extended its gain for the 2nd continuous session. Despite U.S. economic data showing signs of easing in the country’s inflation, the Fed’s officials continue to voice out hawkishly in terms of monetary policy. The market is widely believed that the Fed may add another quarter point to the Fed rate topping it above 5%; the optimism of a rate hike bolstered the U.S. dollar to go strong against major currencies this week. The eurozone CPI data will be released tomorrow ( 19th April) and may flux the pair’s price movement.
The pair has retraced and traded below its crucial price level at 1.1000 but is still trading above its long-term uptrend support line. The indicators showed an easing in bullish momentum for the pair as the RSI dropped to below 50-level and the MACD moved toward the zero line from above.
Resistance level: 1.1030, 1.1126
Support level: 1.0871, 1.0762
On Monday, the Nasdaq index closed higher, with financial and industrial shares driving modest gains across the stock indexes. Investors are preparing for a busy week of corporate results and eagerly anticipating comments from Federal Reserve officials that could offer more clarity on the future of interest rates. The Nasdaq Composite index added 0.28% to reach 12,157 points. However, Google’s parent company, Alphabet Inc, saw its shares decline by 2.7%, dragging down the S&P 500 and Nasdaq, after reports emerged that Samsung Electronics is considering replacing Google with Microsoft’s Bing as its default search engine on its devices.
As we can see, the index keeps floating near the resistance level of 12237 points, and it might have the chance to break above. The MACD line still hovers above the zero line, indicating bullish momentum continues. RSI is at 57, indicating a bullish momentum ahead.
Resistance level: 12250, 12580
Support level: 11948, 11761
On Monday, the pound experienced a slight decline of 0.41% to $1.2377 as investors brace for a busy week of economic data in the U.K. The upcoming data releases will significantly impact the Bank of England’s policy decision on May 11th and shape the prospects of the U.K. currency. Notably, the U.K. is set to release its February jobs report on Tuesday, which will include wage growth figures. March inflation numbers will be released on Wednesday, adding to the data overload.
The MACD line is breaking below the zero line, indicating bearish momentum. RSI is at 41, indicating the pair has entered into bearish momentum.
Resistance level: 1.2422,1.2645
Support level: 1.2155,1.1924
The Dow continues its ascent, propelled by a strong showing in the financial and industrial sectors, even as US Treasury yields surge. As market participants brace themselves for a jam-packed week of earnings reports and remarks from Federal Reserve officials, a clearer picture of the interest rate trajectory may begin to emerge. JP Morgan Chase’s latest financial update, which was bolstered by increased interest income, has helped to assuage concerns surrounding a possible banking crisis. Nevertheless, investors are eagerly anticipating additional updates from other major US banks this week, including Goldman Sachs Group Inc, Bank of America Corp, and Morgan Stanley.
The Dow is trading higher following the prior breakout above the previous resistance level. However, MACD has illustrated diminishing bullish momentum, while RSI is at 65, suggesting the index might enter overbought territory.
Resistance level: 34265.00, 35770.00
Support level: 32650.00, 31435.00
The US Dollar’s relentless march higher is taking a toll on oil prices, with both crude and Brent crude falling by around 2% on Monday – the steepest decline in a month. Market participants are bracing themselves for another quarter-point increase at the Federal Reserve’s upcoming rate decisions on May 3, which is putting downward pressure on oil prices. Nonetheless, the lack of market catalysts for the oil market is making investors cautious. As such, it is advised that they continue to closely monitor economic developments, inventories data, and rate hike decisions from global central banks to gauge the potential trajectory of oil prices.
Oil prices are trading flat while currently testing the support level. MACD has illustrated increasing bearish momentum, while RSI is at 60, suggesting the commodity might extend its losses after breakout since the RSI retreated sharply from overbought territory.
Resistance level: 85.45, 90.04
Support level: 81.06, 77.25

以行業低點差和閃電般的執行速度交易外匯、指數、貴金屬等。
Please note the Website is intended for individuals residing in jurisdictions where accessing the Website is permitted by law.
Please note that PU Prime and its affiliated entities are neither established nor operating in your home jurisdiction.
By clicking the "Acknowledge" button, you confirm that you are entering this website solely based on your initiative and not as a result of any specific marketing outreach. You wish to obtain information from this website which is provided on reverse solicitation in accordance with the laws of your home jurisdiction.
Thank You for Your Acknowledgement!
Ten en cuenta que el sitio web está destinado a personas que residen en jurisdicciones donde el acceso al sitio web está permitido por la ley.
Ten en cuenta que PU Prime y sus entidades afiliadas no están establecidas ni operan en tu jurisdicción de origen.
Al hacer clic en el botón "Aceptar", confirmas que estás ingresando a este sitio web por tu propia iniciativa y no como resultado de ningún esfuerzo de marketing específico. Deseas obtener información de este sitio web que se proporciona mediante solicitud inversa de acuerdo con las leyes de tu jurisdicción de origen.
Thank You for Your Acknowledgement!