PU Prime App
Exclusive deals on mobile


PU Prime App
Exclusive deals on mobile


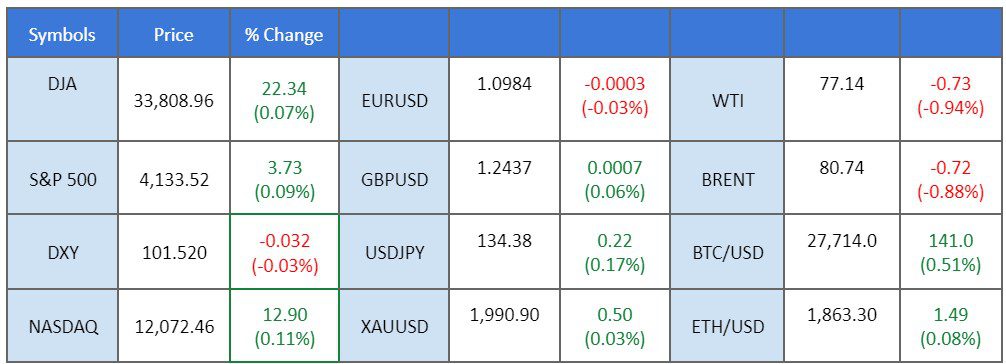
The King Dollar is trading flat as market participants prepare for potential uncertainties. The upcoming release of GDP figures, core PCE price index, and employment cost index are critical for global investors. Meanwhile, the Pound Sterling is experiencing impressive gains from strong UK preliminary PMI survey results, suggesting a robust economic recovery despite recession forecasts. On the other hand, the OPEC+ crude oil rally has hit a speed bump, with concerns of a potential recession and fears of US rate hikes weighing heavily on the market. The Canadian dollar, heavily reliant on oil exports, has taken a hit alongside falling crude oil prices and downbeat domestic retail sales figures.
Current rate hike bets on 3rd May Fed interest rate decision:
Source: CME Fedwatch Tool
25 bps (16.3%) VS 50 bps (83.7%)
Prices as of 03:00 EET


The US Dollar Index, which measures the greenback against a basket of six major currencies, traded flat despite recent economic data pointing to the resilience of the world’s largest economy, as market participants remained sceptical toward the rate hikes decisions from the Federal Reserve. According to Markit, the US Services Purchasing Managers Index (PMI) surged from 52.6 to 53.7, surpassing market expectations of 51.5. The reading hit its highest level since May 2022, highlighting the third consecutive month that the PMI has remained above the 50-mark, indicating growth in the private sector.
The Dollar Index is trading flat while currently testing the support level at 101.65. MACD has illustrated increasing bearish momentum, while RSI is at 44, suggesting the index might extend its losses after its successful breakout below the support level since the RSI stays below the midline.
Resistance level: 102.25, 103.00
Support level: 101.65, 100.85
Gold prices retreated, weighed down by the recent upbeat economic data from the United States. This bolstered market expectations of another 25-basis point rate hike by the Federal Reserve at the upcoming policy meeting in May. The US Services Purchasing Managers Index (PMI), as reported by Markit, surged from 52.6 to 53.7, surpassing market expectations of 51.5.
Gold prices are trading lower while currently near the support level. However, MACD has illustrated increasing bullish momentum, while RSI is at 42, suggesting the commodity might trade higher as technical correction since the RSI rebounded sharply from oversold territory.
Resistance level: 2000.00, 2030.00
Support level: 1975.00, 1945.00
The Euro surged as the services industry reported strong demand hikes, offsetting a decline in manufacturing. The latest data from S&P Global revealed that HCOB’s flash Composite Purchasing Managers’ Index (PMI) for the eurozone soared to an 11-month high of 54.4 in April, up from the previous reading of 53.7. Notably, the PMI covering the services industry climbed to 56.6 this month, surpassing expectations in the Reuters poll, which had anticipated a decline to 54.5. This impressive performance in the services sector is indicative of a positive economic outlook for the eurozone.
EUR/USD is trading higher following the prior rebound from the support level. MACD has illustrated increasing bullish momentum, while RSI is at 53, suggesting the index might extend its gains toward resistance level since the RSI stays above the midline.
Resistance level: 1.1075, 1.1168
Support level: 1.0924, 1.0790
Bitcoin’s recent performance has been underwhelming, as market participants are grappling with the possibility of another interest rate hike by the Federal Reserve. This comes after the release of upbeat US economic data, which has led to a surge in the value of the dollar and a subsequent dip in the cryptocurrency market. Despite briefly breaching the $30,000 threshold, Bitcoin has failed to maintain its momentum and has since plummeted by a staggering 10.30% compared to the previous week.
Bitcoin is trading lower following the prior breakout below the previous support level. However, MACD has illustrated increasing bullish momentum, while RSI is at 42, suggesting BTC might trade higher as technical correction since the RSI rebounded sharply from overbought territory.
Resistance level: 28285, 30680
Support level: 26630, 25295
The Canadian dollar has also taken a hit alongside falling crude oil prices. As a key export of Canada, the relationship between the Canadian dollar and oil prices has become increasingly sensitive. Furthermore, the domestic retail sales figures suggest that higher borrowing costs affect the Canadian economy. According to Statistics Canada, Canadian Core retail sales decreased by 0.70% in February compared to January, which is much worse than the market expectations of -0.10%.
USDCAD is trading higher while currently testing the resistance level. However, MACD has illustrated diminishing bullish momentum, while RSI is at 78, suggesting the pair might enter overbought territory.
Resistance level: 1.3550, 1.3660
Support level: 1.3435, 1.3320
Pound Sterling is currently on an upward trajectory, buoyed by the UK’s preliminary PMI survey results, which point to a strong economic recovery that has defied recession forecasts. The S&P Global/CIPs UK Composite Purchasing Managers’ Index (PMI), which covers both manufacturing and services firms, rose from 52.2 in March to 53.9 in April, representing the strongest growth since April last year and putting it further above the 50-line denoting growth for the third consecutive month.
GBPUSD is trading higher while currently testing the resistance level. MACD has illustrated diminishing bearish momentum, while RSI is at 53, suggesting the pair might extend its gains after successfully breakout above the resistance level.
Resistance level: 1.2455, 1.2545
Support level: 1.2370,1.2275
The Dow was traded flat as investors continued to brace for uncertainties ahead of heavy events. Thursday’s GDP figures and Friday’s core PCE price index and employment cost index from the Federal Reserve are closely watched. The tech sector is also focused as Microsoft, Alphabet, Amazon, and Meta Platforms announce earnings. The market capitalization of these tech giants makes their earnings reports vital for insights into the health of the US economy, with investors closely watching for indications of future market performance.
The Dow Jones index is still suppressed by its strong resistance level at 34265 waiting for a catalyst to break through. The RSI has moved downward from the overbought zone while the MACD has moved flat on the above suggesting that the bullish momentum is diminishing.
Resistance level: 34263, 35520
Support level: 33233, 32238
The recent fears of US rate hikes and a potential recession have dampened the OPEC+ hype rally in crude oil, bringing an end to the market’s four-week winning streak. The US dollar’s rebound from its one-year low has been the main driver of the bearish momentum in the oil market, causing oil prices to become more expensive for overseas buyers.
Oil prices are trading lower while currently testing the support level. However, MACD has illustrated diminishing bearish momentum, while RSI is at 35, suggesting the commodity might be traded higher in short-term as technical correction since the RSI rebounded sharply from oversold territory.
Resistance level: 79.70, 82.55
Support level: 76.95, 73.75

以行業低點差和閃電般的執行速度交易外匯、指數、貴金屬等。
Please note the Website is intended for individuals residing in jurisdictions where accessing the Website is permitted by law.
Please note that PU Prime and its affiliated entities are neither established nor operating in your home jurisdiction.
By clicking the "Acknowledge" button, you confirm that you are entering this website solely based on your initiative and not as a result of any specific marketing outreach. You wish to obtain information from this website which is provided on reverse solicitation in accordance with the laws of your home jurisdiction.
Thank You for Your Acknowledgement!
Ten en cuenta que el sitio web está destinado a personas que residen en jurisdicciones donde el acceso al sitio web está permitido por la ley.
Ten en cuenta que PU Prime y sus entidades afiliadas no están establecidas ni operan en tu jurisdicción de origen.
Al hacer clic en el botón "Aceptar", confirmas que estás ingresando a este sitio web por tu propia iniciativa y no como resultado de ningún esfuerzo de marketing específico. Deseas obtener información de este sitio web que se proporciona mediante solicitud inversa de acuerdo con las leyes de tu jurisdicción de origen.
Thank You for Your Acknowledgement!